If you’ve ever searched for average lead close rates in Australia, you’ve probably run into a problem: most of the data out there is from the US or doesn’t specify your specific industry. While benchmarks can offer helpful insights, they might not always reflect the unique dynamics of your specific situation.
This leaves many Australian businesses wondering:
- How do I know if my close rate is good enough?
- What if my industry’s performance is different from benchmarks?
- How can I improve my close rate, no matter where I start?
The truth is, whether you’re in Australia, the US, or anywhere else, the key isn’t how your close rate compares to others—it’s about how you’re improving over time.
Benchmarks are just a starting point. The real power comes from understanding your own close rate, identifying opportunities for improvement, and taking actionable steps to boost your performance.
In this guide, you’ll learn:
- How to calculate your own close rate and set a baseline
- Why benchmarks can still be useful (and how to adapt them)
- How to diagnose whether you have a lead generation issue or a close rate problem
- Practical strategies to improve your close rate, regardless of your industry or starting point
By the end, you’ll have the tools and confidence to take control of your close rate and turn more leads into customers.
What is a Close Rate?

At its core, a close rate is a simple but powerful metric: it’s the percentage of leads that convert into paying customers. In other words, it measures how well your business is turning opportunities into actual sales.
Close rates go beyond just being a percentage—they’re a window into the health of your sales and marketing efforts. They help you answer critical questions like:
- Are you generating high-quality leads?
- Is your sales team effectively converting opportunities into customers?
- Is your overall strategy aligned with your target audience’s needs?
By understanding your close rate, you can pinpoint where in your funnel things might be breaking down—whether it’s lead generation, nurturing, or final conversion.
What Close Rates Reveal About Your Business
- High Close Rates: A high close rate often indicates strong alignment between your leads and your sales process. It may also suggest that your sales team is performing well
- Low Close Rates: A low close rate can signal issues such as poor lead quality, ineffective follow-up processes, or misaligned messaging
What Close Rates Don’t Tell You
It’s important to remember that close rates are just one part of the bigger picture. A low close rate doesn’t necessarily mean your sales team isn’t performing—it could indicate a problem with the types of leads you’re attracting or even external factors like market conditions.
Now that you know what a close rate is and why it matters, let’s look at how benchmarks can provide some context—and why they might differ for your business.
Close Rate Benchmarks for Your Industry
When it comes to lead close rates, the US is often the go-to source for industry benchmarks.
While this data can provide helpful context, it’s important to remember that these figures are shaped by US-specific factors like market size, consumer behaviour, and competition.
Here’s what you need to know about using US benchmarks—and why they might differ for Australian businesses.
Average Close Rates by Industry (US Data)
Based on available data, here are some examples of average close rates in key industries:
- Software Industry: Approximately 22%. Source: HubSpot Blog
- Finance Industry: Around 19%. Source: HubSpot Blog
- Biotech Industry: About 15%. Source: HubSpot Blog
- Business and Industrial Organizations: Approximately 27%. Source: GetAccept Blog
- Computers and Electronics: Around 23%. Source: GetAccept Blog
- Commercial Insurance: Approximately 1.7%. Source: SmartWinnr
- Pharmaceutical Sales: Around 2.0%. Source: SmartWinnr
- Call Center and Customer Service: About 2.0%. Source: SmartWinnr
- Industrial IoT: Approximately 2.2%. Source: SmartWinnr
- Shipping & Logistics: Around 2.7%. Source: SmartWinnr
- Commercial Real Estate: About 2.8%. Source: SmartWinnr
- Heavy Equipment: Approximately 3.0%. Source: SmartWinnr
- Lending and Loan Servicing: Around 3.0%. Source: SmartWinnr
- Medical Device and Equipment Manufacturing: About 3.1%. Source: SmartWinnr
- Point of Sales (POS) Services: Approximately 7.0%. Source: SmartWinnr
- Legal Services: Around 7.4%. Source: SmartWinnr
Please note that these figures are based on available data and can vary depending on factors such as lead quality, sales processes, and market conditions. Additionally, these benchmarks are primarily derived from U.S. data and may not directly reflect the Australian market due to differences in consumer behavior, market size, and competition.
Average Close Rates by Lead Gen Platform (US Data)
Here’s a list of average close rates by lead generation platform based on available data:
- Google Ads: Average conversion rate is 3.75%.
- Social Media Platforms (e.g., Facebook, Instagram): Average conversion rate is 0.71%.
- Email Marketing: Average conversion rate is 1.51%.
- Organic Search: Average conversion rate is 2.01%.
- Paid Search: Average conversion rate is 2.98%.
- Referral Traffic: Average conversion rate is 3.0%.
- Direct Traffic: Average conversion rate is 3.3%.
- Display Advertising: Average conversion rate is 0.89%.
Source: Ruler Analytics
These rates can vary based on industry, audience targeting, and campaign effectiveness.
Why Benchmarks May Differ for Your Business
While these benchmarks are a useful starting point, several factors can create differences for your business:
- Market Size: The above data comes from the US, and the US market is much larger, which can lead to differences in competition, consumer behaviour, and overall conversion dynamics
- Consumer Behaviour: Australians may have different purchasing habits, such as higher sensitivity to price or greater emphasis on trust-building before making a purchase
- Industry Variability: Certain industries may be more established in one market than the other, leading to differing close rate expectations
Here’s how to make the most of these benchmarks:
- Treat Them as Guidelines: Use benchmarks to understand general performance trends, but focus on how they relate to your own results
- Focus on Relative Performance: Compare your close rate to the benchmarks, but keep in mind that improving your baseline is more important than meeting or exceeding averages
- Adapt to Your Context: Consider how factors like local competition, customer preferences, and economic conditions might influence your close rate
Next, you will learn how to calculate your own close rate and create a personal baseline that reflects your unique business performance.
The Importance of Your Baseline
When it comes to close rates, comparing yourself to industry averages is helpful, but it’s not the most important metric. What truly matters is understanding your own performance—your baseline—and working to improve it over time.
When it comes to close rates, comparing yourself to industry averages is helpful, but it’s not the most important metric. What truly matters is understanding your own performance—your baseline—and working to improve it over time.
Why Your Baseline Matters More Than Benchmarks
- Every Business is Unique: Factors like your industry, target audience, sales process, and even your team’s skills can significantly affect your close rate. Benchmarks don’t always capture these nuances.
- Improvement is the Goal: Whether your close rate is above or below average, the focus should be on consistent progress, not meeting an arbitrary standard.
- Tailored Strategies: By knowing your baseline, you can identify specific areas for improvement that are relevant to your business.
How to Calculate Your Baseline Close Rate
Use this formula to determine your current close rate:

For instance, if you generated 200 leads and closed 40 of them, your close rate is 20%:

Steps to Set Your Baseline
- Track Your Leads and Deals: Use a CRM or spreadsheet to record the number of leads generated and the deals closed over a set period (e.g., monthly or quarterly)
- Segment Your Data: Break down your close rate by channel (e.g., Google Ads, organic search) or audience type to uncover patterns
- Establish a Starting Point: Use your current close rate as the baseline for measuring improvement over time
What to Do Once You Have Your Baseline

- Compare it to any relevant benchmarks you can find (like the US averages discussed earlier)
- Identify trends or discrepancies, such as higher close rates for specific channels or leads stalling at certain points in the funnel
- Set realistic improvement goals, such as increasing your close rate by 2–3% within the next quarter
Your baseline isn’t just a number—it’s a snapshot of your current performance and a foundation for growth.
Once you’ve established it, you can start identifying whether the challenges lie in lead generation, sales processes, or both.
Do I Have a Lead Gen or a Sales Problem?

If your sales aren’t where you want them to be, the first step is figuring out why. Are you struggling to generate enough leads, or is your sales process falling short when it comes to converting them?
Understanding the root cause is critical to making improvements.
Signs You Have a Lead Generation Problem
A lead generation problem occurs when you’re not attracting enough high-quality leads to fill your pipeline. Here’s how to spot it:
- Low Lead Volume: You’re not getting enough inquiries, sign-ups, or contacts to support your sales goals
- Poor Lead Quality: The leads you do get don’t match your ideal customer profile (ICP), resulting in wasted time and effort
- Weak Initial Engagement: Leads are unresponsive to outreach efforts, such as emails, calls, or ads
Solution for poor lead gen efforts:
Focus on optimising your lead generation strategy:
- Refine your targeting criteria
- Use messaging that speaks directly to your ideal customer’s needs
- Create lead magnets (like guides or free trials) to attract more qualified prospects
Here’s a guide on exactly how you can improve your lead generation efforts through paid media.
Signs You Have a Close Rate Problem
A close rate problem happens when you’re generating plenty of good leads, but they’re not turning into customers.
Look for these signs:
- High Lead Volume but Low Conversions: Your campaigns are driving leads, but most aren’t closing
- Stalled Pipeline Progress: Leads lose interest or fail to move to the next stage in your sales funnel
- Frequent Objections: Prospects consistently raise concerns about price, value, or urgency
Solution for poor sales close rates:
If you’re generating plenty of leads but struggling to close them, the issue may not be with your leads—it may be with how you’re guiding them through the sales process.
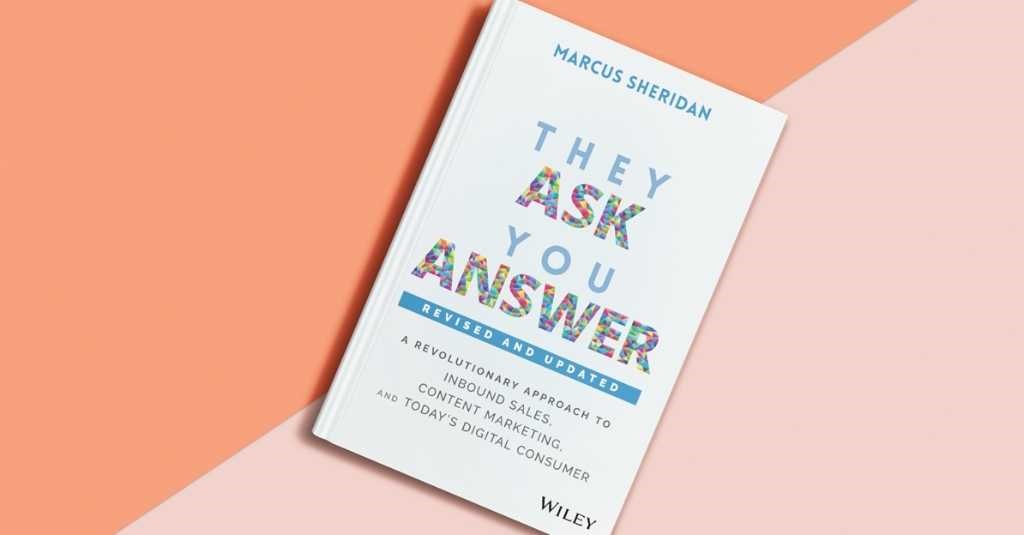
This is where Assignment Selling comes in, a strategy that’s not just about selling but about educating your prospects, so they’re fully prepared to make a decision.
Here’s how it works: Instead of spending your sales meetings answering the same questions over and over again, you provide prospects with educational content ahead of time. Think of this content as their “homework.”
It could be an article, a video, or even a guide that addresses the most common questions, concerns, or objections you hear during the sales process. For example, if price objections or product features always come up, create a resource that dives deep into those topics.
When you assign this content before your meeting, you’re not just saving time—you’re also qualifying your prospects. The ones who actually engage with the material are showing you they’re serious about the process. These are the people who are likely to close.
But it gets even better.
By the time you meet with them, they already understand the basics. They know your pricing, your process, and why your product or service might be the right fit. This means your conversation can go deeper, addressing their specific needs and building a stronger connection. It also shortens the sales cycle, because they’re coming into the meeting informed and ready to make decisions.
To really hit this point home, let’s look at some data.
How many pages of your website would a potential customer be willing to read before they buy?
The answer is 30, according to our internal research. And it turns out that if a prospect reads 30 or more pages of your website, they will buy 80% of the time.
That’s why it’s so important to use your content in the sales process.
Assignment Selling isn’t just about improving close rates—it’s about creating a more efficient, trust-driven sales process. When you educate your prospects first, you don’t just sell them—you empower them to buy.
And that’s a game-changer.
Summary of How to Diagnose Your Problem
Use this checklist to figure out whether your main challenge is lead generation or close rates:
- Is Your Lead Volume Too Low?
If yes, you likely have a lead generation problem. - Are Your Leads Qualified?
If most leads don’t fit your ICP, it’s a lead quality issue tied to lead generation. - Are Leads Stalling in the Pipeline?
If leads stop progressing or ghost you after initial contact, it’s likely a close rate problem. - What Feedback Are You Getting?
If prospects frequently cite price, unclear benefits, or trust concerns, your close rate strategy needs attention.
Once you’ve diagnosed the issue, you can focus your energy on the targeted solutions mentioned above that will have the biggest impact.
So, What’s Next?
Whether your close rate is above average, below average, or somewhere in the middle, the real question you should be asking is, “Am I getting better?”
Improvement starts with knowing your numbers.
Calculate your close rate and use it as your personal baseline—not as a reason to compare yourself to others but as a benchmark to measure your growth.
Then, take a closer look at your process. Is the problem lead generation? Closing strategies? Maybe both? Diagnose the issue, focus your efforts, and take action.
The bottom line is this: consistent, intentional action is what moves the needle. It’s not about being perfect; it’s about showing up every day, making small improvements, and focusing on what you can control. So don’t get caught up in whether your numbers are “good enough.” Instead, ask yourself, “What can I do today to get better?”
When you focus on progress, the results will follow. And before you know it, you won’t just be closing deals—you’ll be building a business that grows stronger with every sale.
Next, check out our article on how to improve your close rates with this 9 word email.


